Nonedecision 2020: Nones and the Changing Composition of Party Coalitions

In last month’s inaugural Nonedecision 2020 column I focused on the nones—Americans who claim no religious affiliation—and their electoral preferences in presidential elections since 1980. We learned that in the past four decades, at least a plurality of the nones has preferred the Democratic candidate, and that the gap has widened over time with no clear sign of closing. The Democratic lean among the nones was just five percentage points in 1980, when a plurality of nones supported Jimmy Carter over Ronald Reagan. In 2016 Hillary Clinton beat Donald Trump among the nones by 42 percentage points.
Only 5 percent of voters were nones in the 1980 election and they were evenly divided in the party coalitions. Four percent of Reagan voters and five percent of Carter voters were nones. The percentage of voting nones tripled to 15 percent by 2016. While the proportion of nones in the electorate tripled, among Republicans it only doubled (just 8 percent of Trump voters were nones). On the other hand, the share of nones in the Democratic coalition quadrupled, increasing to 21 percent in 2016. This change in the parity of the nones in the parties’ coalitions is no accident.
Currently, the partisan breakdown of nonreligious Americans is about three Democrats for every Republican. According to the 2019 Secular Voices Survey I conducted for Socioanalítica Research, 30 percent of the nones identify as Democrats, 10 percent identify as Republican, and the plurality (46 percent) identify as independents. This ratio has been consistent since, at least, the last decade.
In 2009 the Institute for the Study of Secularism in Society and Culture’s landmark report American Nones: The Profile of the No Religion Population, based on the 2008 American Religious Identification Survey (ARIS), found that 34 percent of nones identified as Democrats, 13 percent as Republicans, and 42 percent as independent. This nearly three-to-one ratio of Democrat to Republican was substantially higher than it was in 1990 when the first survey in the ARIS series (the National Survey of Religious Identification) found that 27 percent of nones identified as Democrat and 21 percent as Republican.
These percentages do not tell the whole story of how uneven the partisan leanings of the nones are. In 1990 the nones accounted for about 6 percent of both Democrats and Republicans in the NSRI sample. The nones were a bipartisan group at a time when they accounted for just 8 percent of the population. But just one generation later, the 2008 ARIS survey found that just 8 percent of Republicans were nones. By contrast, 15 percent of Democrats identified as nones in 2008, matching their percentage in the general population. Today just 11 percent of Republicans are nones while one-quarter (25 percent) of Democrats are, once again matching the general population.
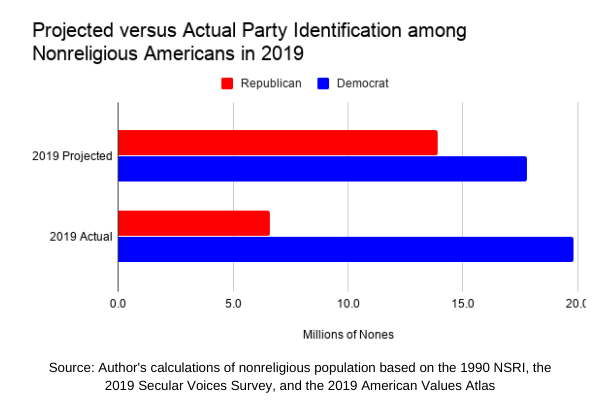
In the two decades between the 1990 NSRI and the 2008 ARIS, the adult none population grew from about fifteen million to thirty-five million. In the decade since, roughly thirty-one million more adults say they are nonreligious. Of the fifteen million nones in 1990, three million were Republicans and four million Democrats. If the nones had kept their partisan preferences constant with their growth today, there would be fourteen million Republican nones and eighteen million Democratic nones. Instead, the actual figures are seven million Republican nones and twenty million Democrats. In essence, Republicans have lost about seven million nones in the last three decades while Democrats have gained two million.
The fact that the great divergence occurred in the 1990s is not coincidental. This was a time when the nones were growing in the population and the Christian right was growing in the Republican Party. As time has passed, the GOP has become whiter and older while the Democratic Party has become more diverse.
At a time when the number of nonreligious Americans continues to grow, the population of nones has also become more diverse in terms of race and gender, while also continuing to gain ground among young Americans.
Next month I’ll explore how the demographics of the nones explain much of their current partisan leanings. Demographics, however, are not destiny, and the fact that the Democrats have not gained as much as the Republicans have lost suggests that many are not happy with the current party system.