Nonedecision 2020: Are the Nones Punching below Their Weight?
 Photo by Phillip Goldsberry on Unsplash
 This Sunday, August 30, I will be giving a virtual presentation for Atheists United in Los Angeles, California. The talk, titled “The Nones and the Future of American Politics,” offers a deep dive into the electoral impact of Americans who claim no religious affiliation. Here I want to discuss one aspect in particular: the voter turnout of American nones.
One of the truisms about secular Americans is that they don’t vote and that their low voter turnout has affected their political power. The main evidence for this has been a comparison of the proportion of the nones in the general population compared to voters who identify as nones in the exit polls. In this piece I will estimate the nones’ turnout and compare it to that of white evangelical Protestants using the general population/exit polls comparison. Then, I will measure turnout using the Comparative Congressional Election Study to compare both groups (nones and white evangelicals).
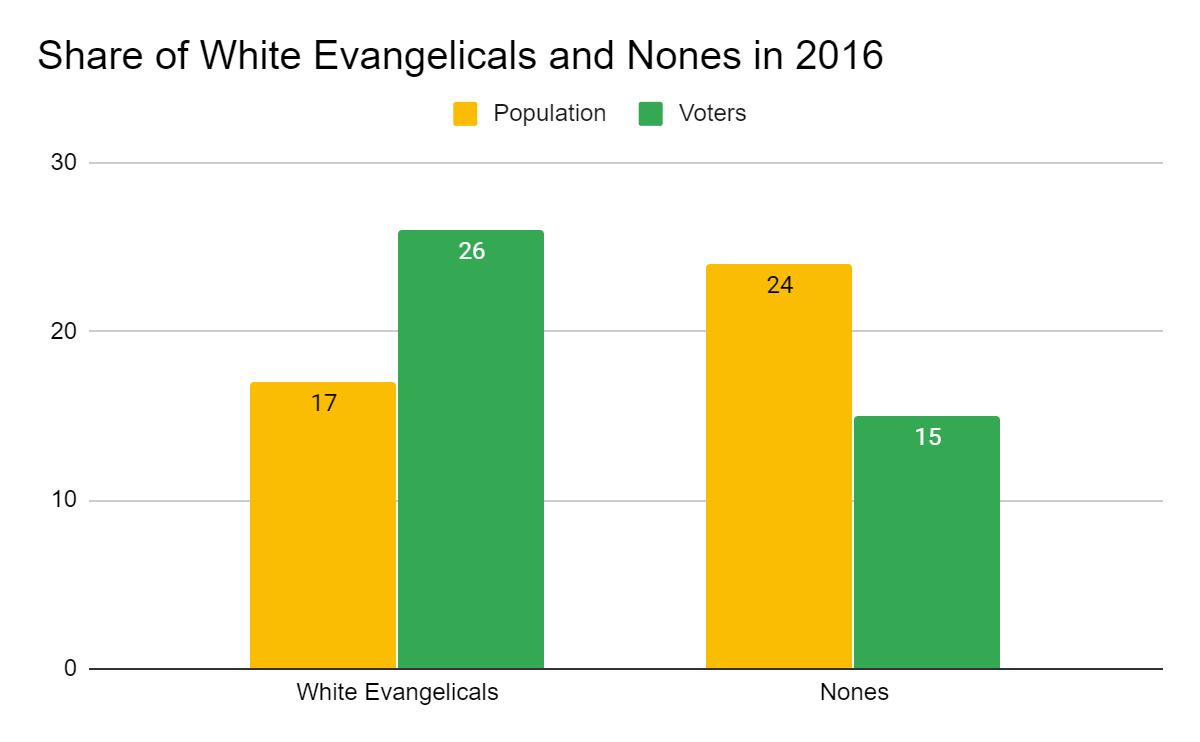
In the 2016 US presidential election, the nones accounted for 24 percent of the general population. According to the exit polls, 15 percent of voters were nones. By contrast, white evangelical Protestants accounted for 17 percent of the population but 26 percent of voters. These numbers suggest white evangelical Protestants are overrepresented among voters and have more influence in our elections than their population size would suggest. On the flip side, it means that the nones are punching below their weight.

Sources: 2016 PRRI American Values Atlas (Population), 2016 National Exit Poll (Voters)
These two numbers, however, are not completely comparable, for they measure the same concepts in different ways. The population numbers gathered from PRRI are based on their religious identification question; the nones (or “religiously unaffiliated” in PRRI’s categorization) are people who say they are “atheist,” “agnostic,” or “nothing in particular” when asked about their religious affiliation. The exit poll question only has one option: “none.” We don’t know if these differences in language lead to differences in the proportion of the people who identify as nonreligious because two different populations are being measured. PRRI is measuring religious identity among adults living in the United States while the exit polls are measuring voting preferences among people who voted in the general election.
We also need to consider how the data are collected. The PRRI survey is conducted by phone, while the exit polls are primarily conducted in person. It’s possible that nonreligious people are less likely to say to an interviewer that they have no religious preference, especially in parts of the country that are very religious. This suggests that nonreligious people are underrepresented among people answering exit polls, not that they’re less likely to turn out.
So far, I haven’t answered the question of whether the nones punch electorally below their weight. This is where the 2016 Cooperative Congressional Election Study comes in. This is a survey of about 60,000 Americans that includes post-election vote validation. Given its size, the CCES can help us better explore the voter participation of nones.
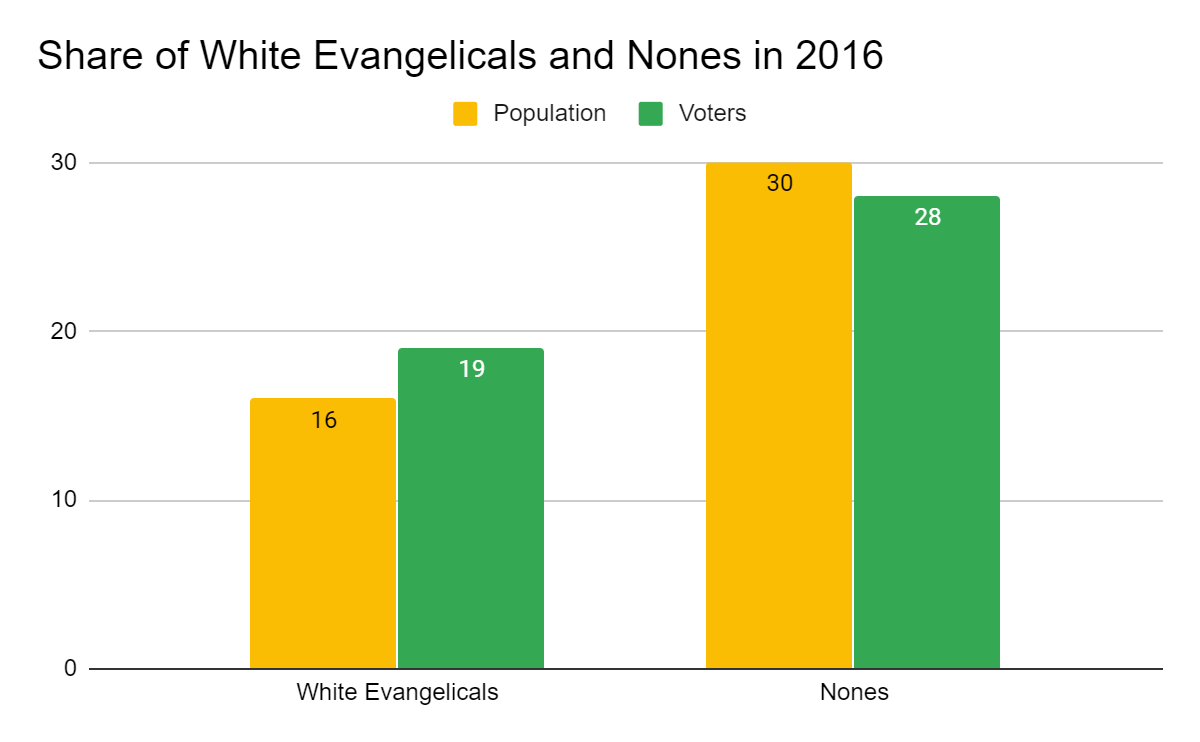
According to the CCES, nones account for 30 percent of the population, while 16 percent are white evangelical Protestants. The differences between the CCES and PRRI’s American Values Atlas (AVA) may be due to the fact that the CCES was conducted online while the AVA is phone-based.
But what about the voter population? The CCES shows that 28 percent of people who voted in 2016 were nones, while 19 percent were white evangelical Protestants. While nones are underrepresented among voters and white evangelicals are overrepresented, the differences are not as large when compared to the population/exit poll comparison.

Source: 2016 Cooperative Congressional Election Study
The first comparison using the exit poll numbers suggests that in a universe of 100 people, twenty-four are nones and seventeen are white evangelicals. However, if fifty people vote (assuming a 50 percent turnout), we’re looking at thirteen white evangelicals and eight nones. White evangelical turnout in this scenario would be 76 percent and 33 percent for nones. Asymmetrical power indeed.
Comparable numbers using the CCES suggest that in that 100-person universe, thirty are nones and sixteen are white evangelicals. But among the fifty who vote, fourteen are nones and ten are white evangelicals: a none turnout of 47 percent versus a white evangelical turnout of 62 percent.
These numbers suggest two things: that nones are underrepresented and that more nones vote than white evangelicals (because there are more nones than white evangelicals in the population). This scenario is more realistic than the general population/exit poll calculation.
But we don’t need to stop there. The voter file validation data of the CCES finds that 64 percent of white evangelicals voted while 51 percent of nones voted in 2016. Certainly, white evangelicals have higher voter turnout than the nones and most other groups for other reasons beyond the scope of this piece. If you take one thing away from reading this, let it be that the nones’ voter turnout in 2016 was not 33 percent— about half the nones voted, roughly in line with the national average. We need to improve the participation of secular voters in elections, but we are starting from a higher baseline than we think we are. To hear more about these data and nones’ politics, tune in to my presentation on Sunday.
